Quality of Life Dashboard
St. Joseph County, Michigan
April 2023
Quality of Life Dashboard
St. Joseph County, Michigan
April 2023
Prepared by iEval
Introduction
In 2022, the Sturgis Area Community Foundation received a Michigan Health Endowment Fund grant to develop a quality of life dashboard for St. Joseph County. A quality of life dashboard is a tool used to measure and track various aspects of a community’s well-being over time. It is a visual representation of different factors that contribute to a person’s overall quality of life, such as health, education, employment, income, housing, transportation, and safety.
The dashboard presents data from St. Joseph County. To develop the dashboard, members from community organizations in the county representing nonprofit organizations, healthcare, education, recreation, government, housing, early childhood, transportation, and law enforcement sectors participated in brainstorming sessions to identify data that were readily available, relevant, and could provide a comprehensive picture of overall quality of life. iEval, an external evaluation team, facilitated the process. Thank you to the following organizations:
- Access to Healthcare Committee
- Branch/Hillsdale/St. Joseph Health Department
- Brett Hamlin, small business owner
- Burr Oak Tool
- Child Abuse & Prevention Council
- City of Sturgis
- Community Mental Health
- Covered Bridge Health
- Department of Health & Human Services
- Domestic & Sexual Assault Services
- ED Commission on Aging
- Glen Oaks Community College
- Glen Oaks Community College Foundation
- Grantsman
- GT Independence
- Habitat for Humanity
- Keystone Place
- Sherriff’s Office
- Southern Michigan Bank
- St. Joseph County Human Services Commission
- St. Joseph County ISD
- St. Joseph County Parks & Recreation
- St. Joseph County Transportation
- St. Joseph County United Way
- Sturges Center for the Arts
- Sturgis Area Community Foundation
- Sturgis Area Schools
- Sturgis Downtown Development Authority
- Sturgis Neighborhood Program
- SW MI Perinatal Region 8
- Three Rivers Chamber of Commerce
- Thurston Woods Village
- Veterans Affairs
The purpose of a quality of life dashboard is to provide organizations, governmental entities, and other decision-makers with a holistic view of the county’s well-being, which can help make more informed decisions about resource allocation, program development, and policy changes. By tracking changes in the indicators over time, the dashboard can also be used to determine needs in the community, spark conversation among organizations, and evaluate the impact of different interventions and initiatives on the quality of life of the population.
Guided Questions
The following questions, when used while reviewing the dashboard, can help organizations and decision-makers make sense of the data, better understand the community, and start conversations to aid in decision-making.
- What are the key indicators being tracked on the dashboard and why do you think they were they chosen by the community representatives?
- What are the trends over time for each of the indicators? Are they improving, declining, or remaining stable?
- Are there any correlations or patterns between different indicators?
- Are there any significant disparities or inequities in the data? Are certain groups experiencing better or worse outcomes than others?
- What are the root causes of any negative trends/disparities? Are there any policy/programmatic changes that could address these issues?
- What are appropriate benchmarks or targets to set as a goal for each indicator?
- How do the results of the dashboard compare to benchmarks or targets set for each indicator? Are they on track to meet these goals?
- Are there any unexpected or surprising results that require further investigation?
- Are there any gaps in the data or limitations to the dashboard that need to be addressed in future iterations?
For each section of the dashboard (i.e., education, safety, transportation), the following questions could be asked to better understand the data:
- What is the overall quality of [section name] in the community and how is it being measured? For example, what is the quality of education?
- What trends in this section require further investigation or intervention?
- How do the outcomes and measures of St. Joseph County that are displayed in this section compare to state averages?
- Are there significant challenges in this sector or system that are affecting the county?
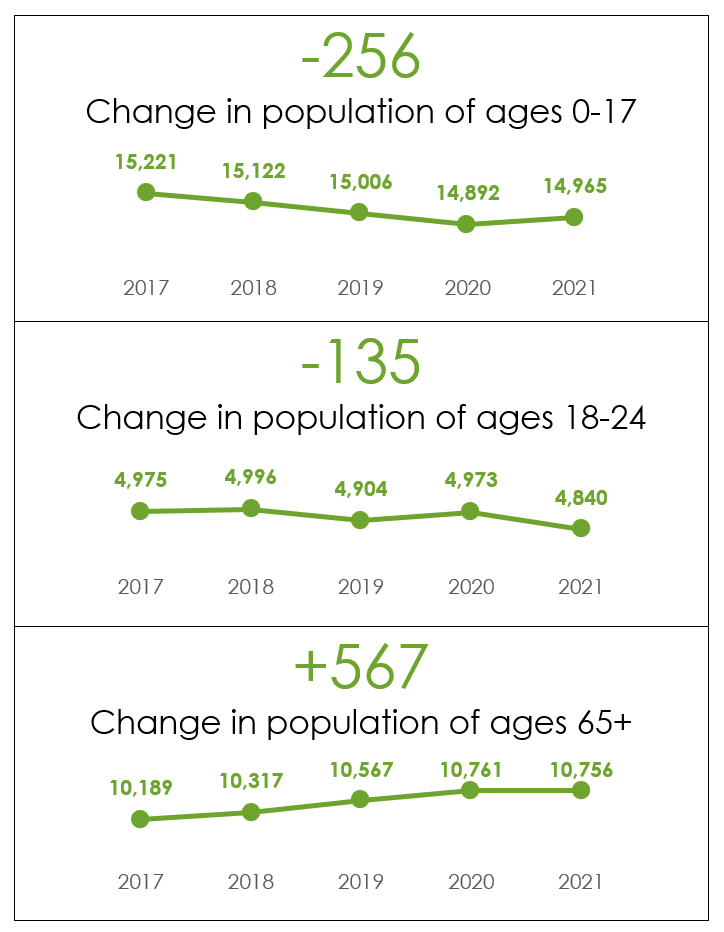
Population by Age
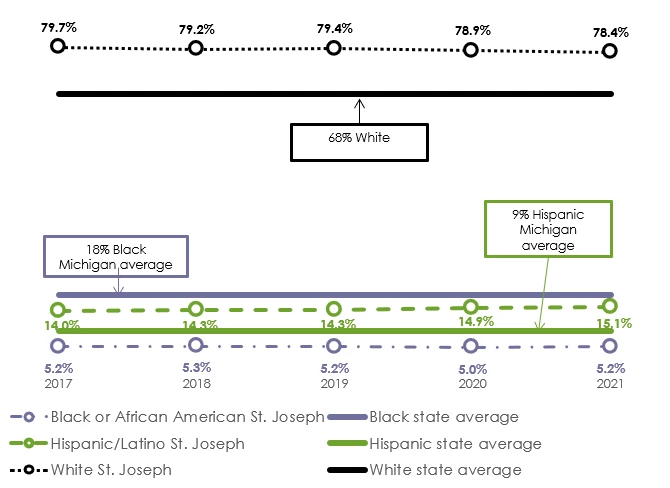
Population by Race
Population by Race (Ages 0-17)
Care of Children
Pregnant women in St. Joseph County receive less prenatal care compared to Michigan averages, and those numbers are fairly steady over the years. About 44% of women in the county receive less than adequate prenatal care and an average of 9% receive late or no prenatal care.
Births with less than adequate prenatal care
(average from 2017-2020)
Births with late or no prenatal care
(average from 2017-2020)
Educational Progression
Health and Wellbeing
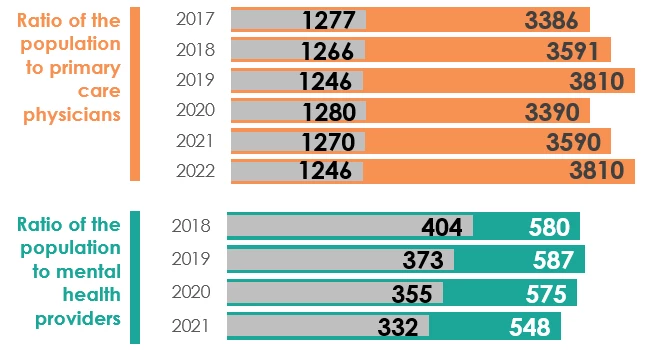
County rankings: Overall health factors based on health behaviors, clinical care, social & economic factors, & physical environment
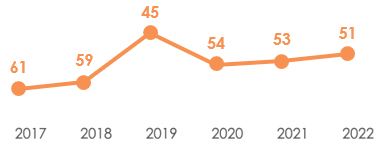
County rankings: Overall health outcomes based on length of life and quality of life
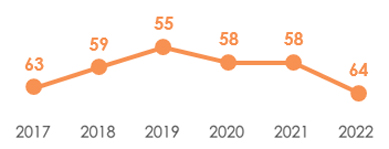
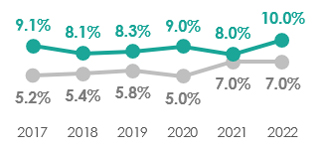
Residents without health insurance
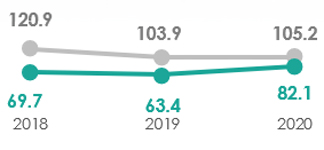
Nonfatal opioid poisoning emergency room visits, rate per 100,000
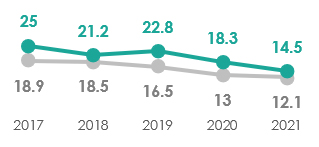
Confirmed victims (0-17) of abuse and/or neglect, rate per thousand
Housing
Internet and Computers
Poverty and Food Insecurity
Food insecurity (percent of county)
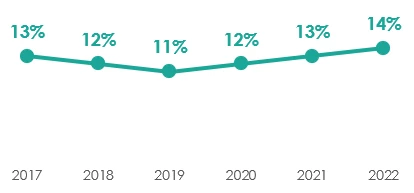
Recreation
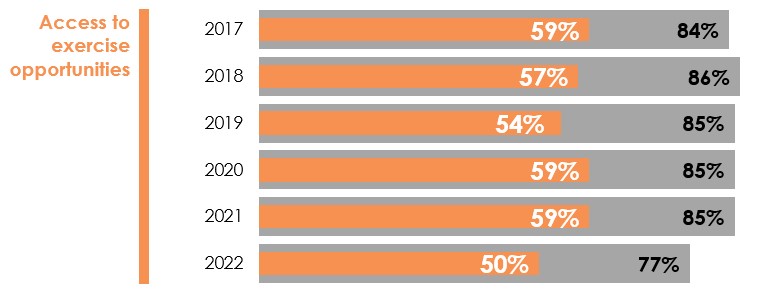
Safety
Arrests: Aggravated felonious assaults (13002)

Arrests: Burglary/Forced Entry (22001)

Arrests: Motor vehicle theft (24001)

Arrests: Retail fraud theft (30002)

Percentage of driving deaths involving alcohol
